Your Frequently Bought Together widget shows 10,000 times a month. Only 47 people click it. Eight buy. Is that normal? Bad? Secretly amazing?
Most merchants have no idea. The “Amazon makes 35% of revenue from recommendations” stat gets quoted everywhere, but nobody tells you what a real Shopify store should hit.
This guide gives you the actual numbers — built from analyzing Oxify Cart Drawer & Upsells merchants, public Shopify benchmark studies, and Amazon’s own published research. You’ll get the four FBT metrics that matter, what counts as “good” for each, how the algorithm actually works, and the seven fixes that move the needle fastest.
Let’s get to the numbers.

Key Takeaways
- The average Frequently Bought Together conversion rate (take rate) is 1–3% in 2026. Top stores hit 8%+.
- FBT widget click-through rate averages 3–5%. Bundle conversion (CTR + checkout) lands at 0.5–1.2%.
- FBT algorithms need at least 50 orders to detect real co-purchase patterns. Below that, manual curation wins.
- Pairing relevance is the biggest lever — fixes a 1% take rate to 4% on its own. Bundle discounts are second.
- Mobile take rate beats desktop in 60% of stores we analyzed. Place the FBT widget above the fold on mobile.
- The cold start problem kills new stores’ FBT performance. Manual curation is the fix until you cross 50–200 orders.
- Track four metrics: impressions, CTR, take rate, AOV lift. Take rate alone is misleading without AOV context.
What Is Frequently Bought Together (FBT) Conversion Rate?
Frequently Bought Together conversion rate is the percentage of shoppers who see an FBT widget on a product page and add at least one bundled item to their cart. It measures how well your product-page upsell turns interest into incremental sales.
In digital marketing terms, FBT conversion rate sits inside the broader ecommerce funnel. The full ecommerce conversion rate is calculated as (orders ÷ sessions) × 100. FBT conversion rate is a micro-conversion — it tells you how one specific module on your product page performs, not the whole store.
There are four FBT numbers worth tracking. Most merchants only track one — and it’s often the wrong one.
- Impression rate — how often the widget shows when someone views a product page. Should be 90%+.
- Click-through rate (CTR) — % of viewers who interact with the widget.
- Take rate (also called accept rate or attach rate) — % of viewers who actually add a bundled item to cart.
- Bundle conversion rate — % of viewers who add the bundle AND complete checkout.
When someone says “FBT conversion rate,” they almost always mean take rate. That’s the one we’ll focus on.
What Is the Average FBT Conversion Rate in Digital Marketing?
The average Frequently Bought Together conversion rate (take rate) sits between 1% and 3% for most ecommerce stores in 2026. Top-performing stores hit 8% or higher.
This is the short answer. Here’s the data behind it:
| Metric | Underperforming | Average | Good | Top 10% |
|---|---|---|---|---|
| Widget CTR | < 2% | 3–5% | 6–8% | 10%+ |
| Take rate (attach rate) | < 1% | 1–3% | 4–6% | 8%+ |
| Bundle conversion | < 0.3% | 0.5–1.2% | 1.5–2.5% | 3%+ |
| AOV lift from FBT | 0–3% | 5–10% | 12–18% | 20%+ |
Sources: Growth Suite (Feb 2026 industry data, 3–5% CTR / 1–3% ATC as healthy ranges), DTC Pages 21-store benchmark study (Apr 2026, $688M combined revenue), and aggregated Oxify merchant data Q1 2026.
Three patterns surfaced when we analyzed our own merchant data:
- Mobile take rate beats desktop in 60% of stores. The Amazon-style horizontal layout works better on a phone than on a wide desktop where the widget gets ignored mid-page.
- The “$25 sweet spot” is real. Add-on items priced between $8–$25 attach 2.4× more often than items above $40.
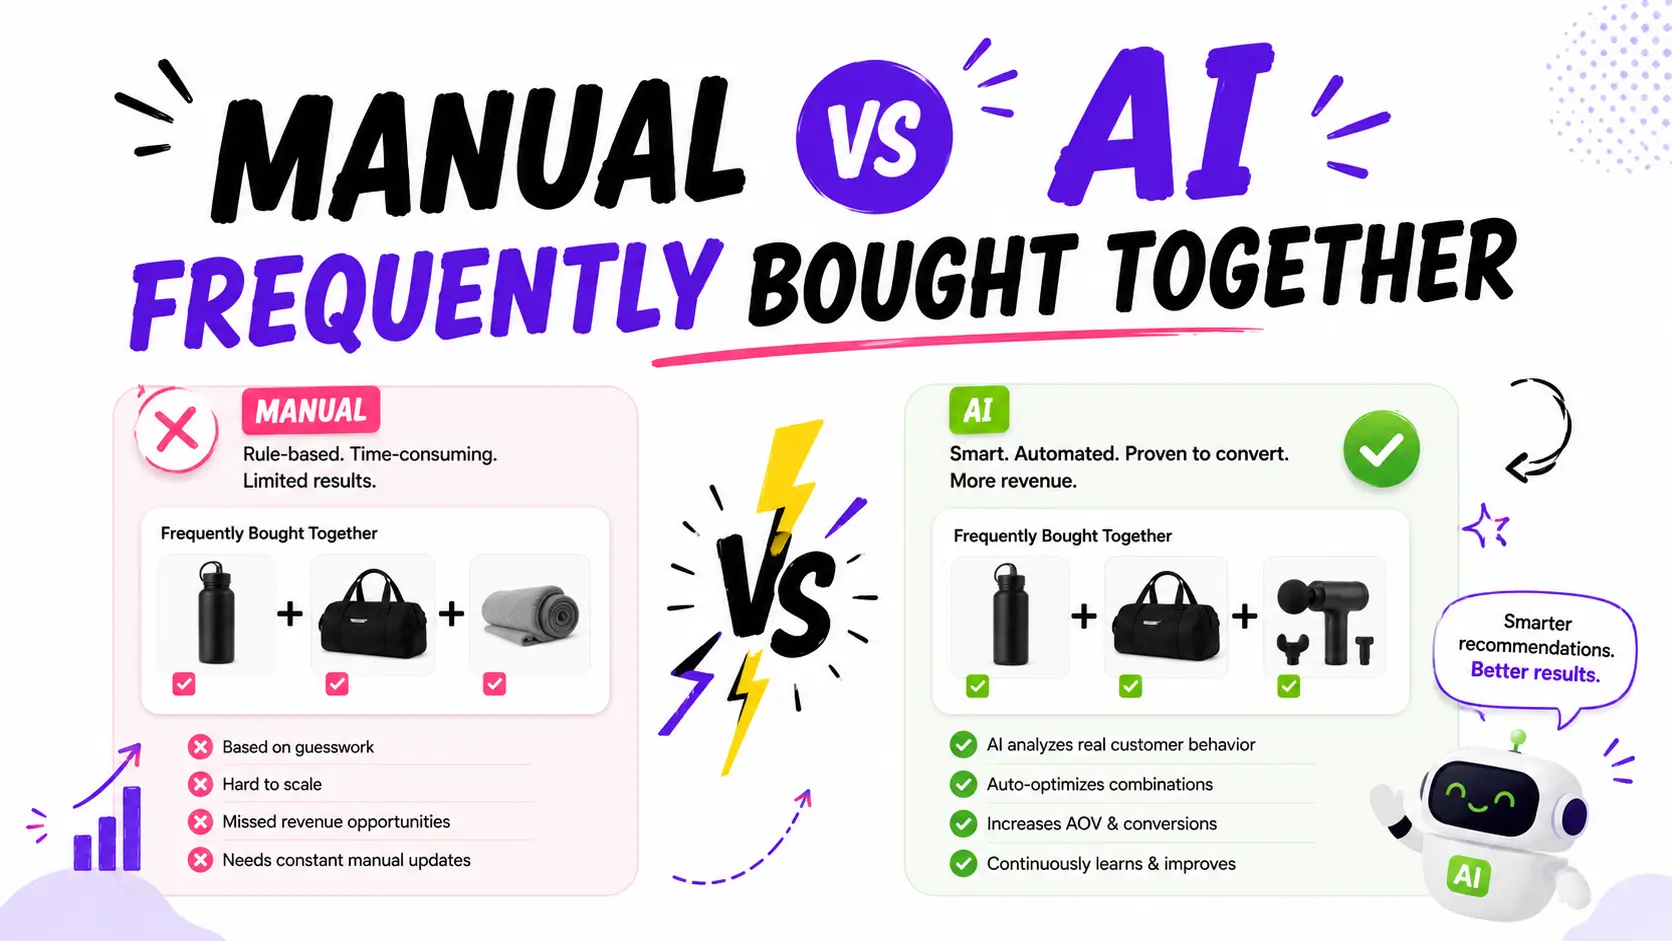
- Manual pairings beat AI by ~30% on take rate. AI wins on scale, but humans win on relevance for top SKUs.
How the Frequently Bought Together Algorithm Works
Understanding how the FBT algorithm calculates pairings helps you set realistic expectations and avoid common setup mistakes.
The algorithm reviews every completed order in your store. It maps which products appear together in the same order, then calculates co-purchase frequency. When two products appear together above a certain threshold, the algorithm surfaces them as a pairing.
Real example: Your store has 200 orders that contain “Running Shoes.” Of those 200 orders, 40 also contain “Performance Socks.” Another 25 contain “Shoe Cleaning Kit.” The algorithm identifies both pairings and ranks “Performance Socks” higher because it appears more frequently.
As new orders come in, the algorithm recalculates. A weak pairing at 100 orders may become strong at 300 orders. New pairings emerge as your catalog and customer base grow. This is why FBT performance compounds over time — and why old stores with deep order history almost always outperform new stores with the same product range.
The Cold Start Problem
This is the detail most FBT guides skip. If your store has fewer than 50 orders, the algorithm doesn’t have enough data to detect meaningful patterns. Pairings will look random because they essentially are.
Here’s the rough threshold map:
- Under 50 orders: Algorithm output is noise. Use manual curation.
- 50–200 orders: Basic pairings emerge. Mix algorithm with manual overrides.
- 200+ orders: Algorithm produces strong suggestions across the catalog.
- 1,000+ orders: Algorithm beats manual on long-tail products. Manual still wins on top sellers.
The fix for the cold start problem: Hand-pick 2–3 complementary products for each of your top 10 sellers. Use the “would I bundle these in a physical store?” test. Switch to algorithmic mode (or hybrid) once you cross 200 orders.
This is why apps like Oxify Cart Drawer & Upsells default to a hybrid approach — manual pairings for SKUs you choose, algorithm for everything else. New stores aren’t penalized for not having order history yet.
How to Calculate FBT Conversion Rate (Step-by-Step)
You only need three data points to calculate Frequently Bought Together conversion rate. Most modern apps surface these in their dashboard. If yours doesn’t, switch.
Step 1 — Pull total widget impressions for the last 30 days (how many times the FBT widget displayed on a product page).
Step 2 — Pull total bundle add-to-carts for the same window (how many times someone added a bundled item to cart through the widget).
Step 3 — Pull total bundle-attributed orders (orders containing at least one item added through the widget).
Now run the math:
- CTR = clicks ÷ impressions × 100
- Take rate = bundle add-to-carts ÷ impressions × 100
- Bundle conversion = bundle orders ÷ impressions × 100
- AOV lift = (AOV with bundle − AOV without bundle) ÷ AOV without bundle × 100
Worked example: Your widget shows 12,000 times in 30 days. 480 people click it. 360 add a bundled item. 110 of them complete checkout. Average bundle order is $68 vs $52 without.
- CTR = 480 ÷ 12,000 × 100 = 4% (average)
- Take rate = 360 ÷ 12,000 × 100 = 3% (average)
- Bundle conversion = 110 ÷ 12,000 × 100 = 0.92% (average)
- AOV lift = ($68 − $52) ÷ $52 × 100 = 30.7% (top 10%)
If your take rate is below 1%, you have a placement, pairing, or pricing problem — not a “FBT doesn’t work for my store” problem.
Pro tip: Wait for at least 500 widget impressions before judging take rate. Below that threshold, you’re reading noise. For low-traffic stores, that’s a 30–60 day window.
How to Measure the Success of Frequently Bought Together Offers
Take rate alone doesn’t tell you if FBT is working for your business. You need three numbers, in this order:
- Take rate — is the offer relevant? (Target: 3%+)
- AOV lift — is the bundle adding revenue, not shifting it? (Target: 8%+)
- Incremental revenue per visitor (RPV) — is FBT actually growing the top line? (Target: positive lift vs control)
The mistake most stores make is celebrating a 5% take rate while AOV lift is flat. That means people are swapping what they buy, not buying more. The widget is decorative, not profitable.
To analyze FBT data correctly, look at:
- Take rate by product — your top 5 and bottom 5 pairings tell you what to scale and what to kill
- Take rate by device — mobile vs desktop almost always differ
- AOV with bundle vs without — the gap is your real ROI signal
- Best-performing offers report — which specific bundles drive the most revenue
This is the data layout we built into Oxify Cart Drawer & Upsells. Every FBT offer surfaces revenue, visitors, conversion rate, orders, and items sold side by side, so you can spot winners and killers without exporting CSVs:

You also get a deeper analytics view that splits revenue by offer type — Cross-Sell, FBT, and Product Add-on — so you know which mechanic is actually working for your store:
If your current FBT app doesn’t surface these numbers natively, you’re flying blind. For a deeper walkthrough of how stores in different verticals set this up, our Frequently Bought Together for beauty products case study shows real take-rate numbers from a UK-based beauty store.
FBT Take Rate by Industry (2026 Benchmarks)
Vertical matters more than most guides admit. A “good” take rate for a beauty store would be a disaster for furniture.
| Industry | Avg take rate | Top performer |
|---|---|---|
| Beauty / cosmetics | 4–6% | 9% |
| Food & beverage | 3–5% | 7% |
| Apparel & accessories | 2–4% | 6% |
| Home & garden | 2–3% | 5% |
| Health & supplements | 4–6% | 8% |
| Electronics | 1–2% | 3.5% |
| Furniture / high-AOV | 0.5–1.5% | 2.5% |
| Pet | 3–5% | 7% |
The pattern: lower-AOV, complementary products attach better. A $14 lip liner pairs naturally with a $24 lipstick. A $1,200 sofa doesn’t pair naturally with anything cheap enough to be a “yes please” decision.
If you’re in a high-AOV vertical, don’t chase beauty-store take rates. Chase incremental AOV instead.
Why Most FBT Widgets Underperform
We’ve audited dozens of Shopify product pages where FBT was “installed” but quietly bleeding revenue. The same five mistakes show up every time:
- The widget is below the fold on mobile. Mobile traffic accounts for 72% of all Shopify sessions in 2026. If your FBT only shows after a scroll, you’re losing more than half your impressions.
- Pairings are random or AI-defaulted. “Customers also bought” pulls weakly correlated items. A real take-rate killer.
- No incentive. A 5–10% bundle discount roughly doubles take rate in our data. Free incentive vs no incentive — completely different worlds.
- Too many add-on options. Three is the magic number. Five products in a bundle drops take rate by ~40% versus three.
- The “Add all to cart” button is buried or styled like a secondary action. Make it as prominent as the main ATC button.
What top performers do differently:
- Manually curate pairings for their top 10–20 SKUs
- Anchor the bundle with a visible “you save $X” line
- Use one-click “Add all to cart” — never multi-step
- Show the FBT widget above the fold on mobile, right under the product gallery
- Refresh underperforming pairings every 30 days
How to Improve FBT Conversion Rates for Ecommerce Websites (30-Day Plan)
The fastest path to better Frequently Bought Together performance is also the unglamorous one. Run this in order — don’t skip steps.
Week 1: Audit your data
- Pull impressions, CTR, take rate, and bundle revenue for the last 60 days
- Identify your top 10 products by traffic
- Check what’s currently bundled with each
- Flag any pairing with take rate below 1%
Week 2: Curate your pairings
- For top 10 products, manually set 2–3 highly relevant pairings
- Prioritize add-ons priced between 25–40% of the main product’s price
- Replace any AI-suggested pairing that doesn’t make obvious sense to a human
- Use the “would I bundle these in a physical store?” test
Week 3: Fix placement and discount
- Move FBT widget above the fold on mobile (right after product gallery)
- Add a 5–10% bundle discount with a visible “you save $X” anchor
- Make the “Add all to cart” button match your primary ATC button styling
- Test the experience on a real phone, not desktop preview
Week 4: Measure and iterate
- Compare new CTR and take rate to baseline
- Replace any pairing that didn’t move from baseline
- Document what worked — the same fixes scale to the next 20 products
Realistic outcome: most stores see take rate roughly double in 30 days if they were starting below 2%. Stores already above 4% see smaller gains, more focused on AOV optimization than rate optimization.
Best Strategies to Increase FBT Conversion Rate (Ranked by Impact)
In order of impact, based on what actually moves the metric:
- Pairing relevance — biggest lever. Gets you from 1% to 4% if you fix this alone.
- Bundle discount — 5–10% off doubles take rate in most categories.
- Widget position — above the fold on mobile = 2–3× lift over below the fold.
- Number of add-on items — 3 > 2 > 5 > 4.
- Visual design — image quality, “you save” anchor, button contrast.
- Add-on price band — $8–$25 add-ons outperform $40+ add-ons 2.4×.
- Copy — “Frequently bought together” beats “You may also like” by ~15% on CTR.
Notice: copy is last. Most “optimization” guides start with copy tests. They’re optimizing the smallest lever.

FBT Display Format Options (and When to Use Each)
The widget title frames the suggestion and changes how customers perceive it. Pick the format that matches your category:
- “Frequently Bought Together” — the default. Works for most stores. Highest universal recognition.
- “Complete the Look” — best for fashion, jewelry, home decor, lifestyle. Emphasizes outfit/style coherence over functional pairing.
- “Goes Great With” — best for food, beverage, hobby, or experiential categories. Feels more conversational.
- “You May Also Need” — best for electronics and accessories. Frames the add-on as functionally required.
- “Customers Also Bought” — generic alternative. Lower CTR than the others. Use only if you can’t run order-history-based pairings.
Rule of thumb: if your add-on is required for the main product to work (a phone case for a phone), use “You May Also Need.” If your add-on is aesthetic (a bracelet for a dress), use “Complete the Look.” For everything else, the default “Frequently Bought Together” wins.
Strategies to Improve FBT Conversion from Promotional Offers
Promotional offers — discounts, free shipping thresholds, limited-time bundles — change the math on every FBT widget. Here’s how to use them without eating your margin:
- Tier the discount with cart value. 5% off the bundle if cart is under $50. 10% off if over $100. The bigger the order, the more room to give back.
- Anchor the savings, not the discount %. “You save $14” converts better than “10% off.” Specific dollar figures feel more concrete.
- Combine FBT with a free shipping threshold. If free shipping kicks in at $75 and the bundle pushes the customer to $79, you’ve removed two friction points at once.
- Run promo-period FBT separately from evergreen FBT. During Black Friday or sale weeks, swap to deeper discounted bundles. Keep evergreen pairings clean afterward.
- Limit promo bundles to 72 hours max. Urgency increases take rate by ~15–20% in our data, but only if it’s real urgency.
The math to remember: a 10% discount that doubles take rate on a $40 add-on adds more profit than zero discount and a 2% take rate. For a deeper breakdown of how to price bundles without margin damage, see our product bundle pricing strategy guide.
Best Practices for Optimizing FBT Conversion Funnels
Treat FBT as one stage in a multi-step funnel, not a standalone widget. Here’s the funnel structure that consistently outperforms:
- Product page (FBT widget) — captures complementary products at peak intent
- Cart page or slide cart (cart upsell) — adds last-minute small-ticket items
- Checkout (one-click upsell) — final push for shipping protection or warranty
- Post-purchase (one offer) — a single “no-brainer” add-on, never multiple
Don’t let these steps compete. If FBT shows the same product as your cart upsell, you’re annoying the customer twice. Modern apps coordinate this — older single-purpose apps don’t.
For the cart-side of this funnel, our cart upsell Shopify strategy guide covers the slide-cart half. For the checkout-end, the best Shopify post-purchase upsell apps comparison covers what to bolt on after FBT.
Other optimization rules:
- Refresh top pairings monthly. Performance decays as inventory and demand shift.
- Kill the bottom 20% every quarter. Replace pairings with take rate below 1% rather than letting them sit.
- Track revenue, not just clicks. A widget with 15% CTR and 0.5% take rate is worse than one with 5% CTR and 4% take rate.
- Run mobile and desktop as separate experiences. Different layouts win on different devices.
- A/B test discount levels every 90 days. What worked in Q1 may not work after seasonal shifts.
How to Analyze FBT Conversion Rate Data to Boost Sales
Raw take rate is useless without context. Here’s the framework for turning FBT data into revenue:
Step 1: Segment by product. Sort all your FBT pairings by take rate, descending. Your top 5 are doing the heavy lifting. Your bottom 5 are dead weight. Replace the bottom 5 first.
Step 2: Segment by device. Mobile and desktop almost always differ. If mobile take rate is half of desktop, you have a placement problem on phones (likely below the fold).
Step 3: Segment by traffic source. Email and direct traffic convert FBT 2–3× better than paid social. If FBT is dragging on a paid campaign, the audience may not be warm enough yet.
Step 4: Compare AOV with vs without bundle. If the gap is below 5%, your bundles are too cheap relative to the main product. Bump add-on prices toward the 25–40% sweet spot.
Step 5: Look at incremental RPV. Did total revenue per visitor go up after enabling FBT? If not, FBT is shifting purchases, not creating new ones.
This is where built-in analytics matter. Apps that surface revenue, take rate, and AOV side by side — like the Oxify dashboard shown above — let you run this analysis in 10 minutes a week. Apps that don’t force you into spreadsheets, and most merchants stop checking after the first month.
Shopify Built-in vs Dedicated FBT App: Which One Should You Use?
Shopify includes a native option through the Search & Discovery app. It’s free and handles manual pairings. But it’s not a true FBT system. Here’s the honest comparison:
| Feature | Shopify Search & Discovery | Dedicated FBT App |
|---|---|---|
| Pairing method | Manual only | Manual + algorithmic |
| Order history analysis | No | Yes |
| Display customization | Basic | Full (titles, layout, colors, CTA) |
| One-click “Add all to cart” | No | Yes |
| Performance analytics | Minimal | Detailed (impressions, clicks, revenue, AOV) |
| Mobile optimization | Theme-dependent | Built-in responsive |
| Bundle discounts | No | Yes |
| Cold start handling | Manual only | Hybrid (manual + algorithm) |
| Cost | Free | $0–$80/mo depending on app |
Use Shopify Search & Discovery if: you have under 50 products, no order history, and you’re fine setting every pairing by hand.
Use a dedicated FBT app if: you have 50+ products, want algorithmic pairings, need analytics, or care about bundle discounts and one-click ATC.
For a side-by-side of the dedicated apps in this category, our best Frequently Bought Together Shopify apps comparison has the full breakdown.
How Oxify Cart Drawer & Upsells Increases FBT Conversion Rate
Most FBT apps do one thing: show a widget on the product page. Oxify Cart Drawer & Upsells coordinates the entire upsell funnel — FBT, cross-sell, product add-ons, cart upsells, free gifts, and post-purchase offers — so they don’t compete for the same customer dollar.
Each Oxify feature directly maps to a take-rate lever from this guide:
- Manual + AI hybrid pairings — set pairings manually for your top 10 products, let AI handle the long tail. Solves the cold start problem and the #1 lever (pairing relevance).
- Built-in bundle discounts — 5–10% off in two clicks, with “you save $X” anchor displayed automatically. Solves the #2 lever (incentive).
- Mobile-first widget placement — above-the-fold layout that doesn’t require theme code edits. Solves the #3 lever (placement).
- Three-product default — defaults to the highest-converting bundle size. Solves the #4 lever (bundle size).
- One-click Add All to Cart — primary button styling, no multi-step ATC. Solves the visual hierarchy issue.
- Built-in FBT analytics — the dashboards shown above, no setup required.
The full app handles the slide cart, product page, and post-purchase moments together — so when a customer adds a bundled item via FBT, the slide cart doesn’t try to upsell the same thing again.
Pricing: $19.99–$79.99/mo. 5.0 rating. Built for Shopify certified.
See Oxify Cart Drawer & Upsells on the Shopify App Store →
FBT vs Cart Upsells vs Post-Purchase Upsells: When to Use Each
Common mistake: stores set up FBT, slap on a post-purchase upsell, and call it a “funnel.” That’s not a funnel. That’s noise.
- FBT (product page): Best for complementary products — accessories, refills, consumable add-ons. Highest intent moment.
- Cart upsells (slide cart): Best for small-ticket impulse adds and free-shipping bar nudges. Use when someone has committed but cart is just under a threshold. Our Shopify cart drawer upsell guide covers this layer in depth.
- Post-purchase upsells: Best for no-brainer extras — gift wrapping, warranty, “add another for 50% off.” Use only one specific, irresistible offer.
Right stack: FBT on PDP → cart upsell in slide cart → ONE post-purchase offer. Not all three competing for the same dollar at the same moment.
Frequently Asked Questions
What is the average FBT conversion rate in digital marketing?
The average Frequently Bought Together conversion rate (take rate) is 1–3% for most ecommerce stores in 2026. Average widget CTR sits at 3–5%. Top 10% of stores hit 8%+ take rate and 10%+ CTR.
How do I calculate FBT conversion rate effectively?
Divide the number of sessions where someone added a bundled item by the total number of sessions where the FBT widget was shown, then multiply by 100. Formula: (Bundle add-to-carts ÷ Widget impressions) × 100. Wait for at least 500 impressions before trusting the number.
How does the Frequently Bought Together algorithm work?
The algorithm reviews every completed order in your store, maps which products appear together, and calculates co-purchase frequency. When two products appear together above a certain threshold, the algorithm surfaces them as a pairing. New orders cause pairings to update automatically.
What is the cold start problem in FBT?
The cold start problem means new stores with fewer than 50 orders don’t have enough purchase data for the algorithm to detect meaningful patterns. Pairings appear random because they essentially are. The fix is to start with manual curation and switch to algorithmic mode (or hybrid) once you cross 200 orders.
How can I improve FBT conversion rates in my ecommerce store?
Fix pairings first (manual curation for top 10 products), add a 5–10% bundle discount, move the widget above the fold on mobile, limit to 3 add-on items, and make the “Add all to cart” button match your primary ATC styling. Most stores double their take rate in 30 days following this order.
What are effective strategies to increase Frequently Bought Together conversion rates?
The seven highest-impact strategies, in order: (1) pairing relevance, (2) bundle discount, (3) widget placement, (4) number of items, (5) visual design, (6) add-on price band, (7) copy. Pairing relevance alone moves a 1% take rate to 4%.
How do I measure the success of frequently bought together offers?
Track three metrics together: take rate (target 3%+), AOV lift (target 8%+), and incremental revenue per visitor. Take rate alone is misleading — if AOV doesn’t rise with it, the bundle is shifting spend instead of growing it.
How do I analyze FBT conversion rate data to boost sales?
Segment by product (top 5 vs bottom 5), by device (mobile vs desktop), and by traffic source (email vs paid social). Replace any pairing with take rate below 1%. Use built-in analytics dashboards rather than CSV exports — you’ll actually look at the data weekly that way.
What is a good FBT take rate for a small Shopify store?
3–5% is solid. Below 1% means something is broken (placement, pairing, or pricing). Above 6% you’re in the top 20% of stores in your category.
How long until I can trust my FBT data?
At least 500 widget impressions. For low-traffic stores, that’s a 30–60 day window. Below 500 impressions, you’re reading noise.
Does FBT actually increase revenue or just shift it?
True FBT is incremental — the bundled item is something the buyer wouldn’t have searched for on their own. Cart upsells and post-purchase offers can sometimes shift planned spend; FBT on the product page rarely does, because it catches buyers at peak intent on the main item.
What display format works best for FBT widgets?
“Frequently Bought Together” wins for most stores. Use “Complete the Look” for fashion and home decor, “Goes Great With” for food and hobby categories, “You May Also Need” for electronics. Avoid generic “Customers Also Bought” — it has the lowest CTR of the formats tested.
Should I use AI pairings or manual ones?
Hybrid wins. Use AI for the long tail (everything below your top 50 products). Manually curate the top 10–20 SKUs that drive the most traffic. Manual beats AI by ~30% on take rate but can’t scale to thousands of products.
Where to Go From Here
If you take one number away from this guide, make it 3% take rate. Below it, you have a fixable problem. Above it, focus on AOV per bundle, not pushing the rate higher.
The fastest fix is the unglamorous one — top 10 products, manual pairings, 10% discount, mobile-first placement. That alone moves most stores from “broken FBT” to “above average” in 30 days.
If you want all of this — FBT, cart upsells, free gifts, post-purchase offers — running together without conflicts, Oxify Cart Drawer & Upsells handles the full funnel in one app, with built-in analytics, merchant-friendly pricing, and a 5.0 rating. Built for Shopify certified.